
DDA-MAT-01 (Material PSD) is a DEPRODATA microapp for reproducible post-processing, visualization, and reporting of mass-based particle size distributions from laboratory sieve-analysis data.
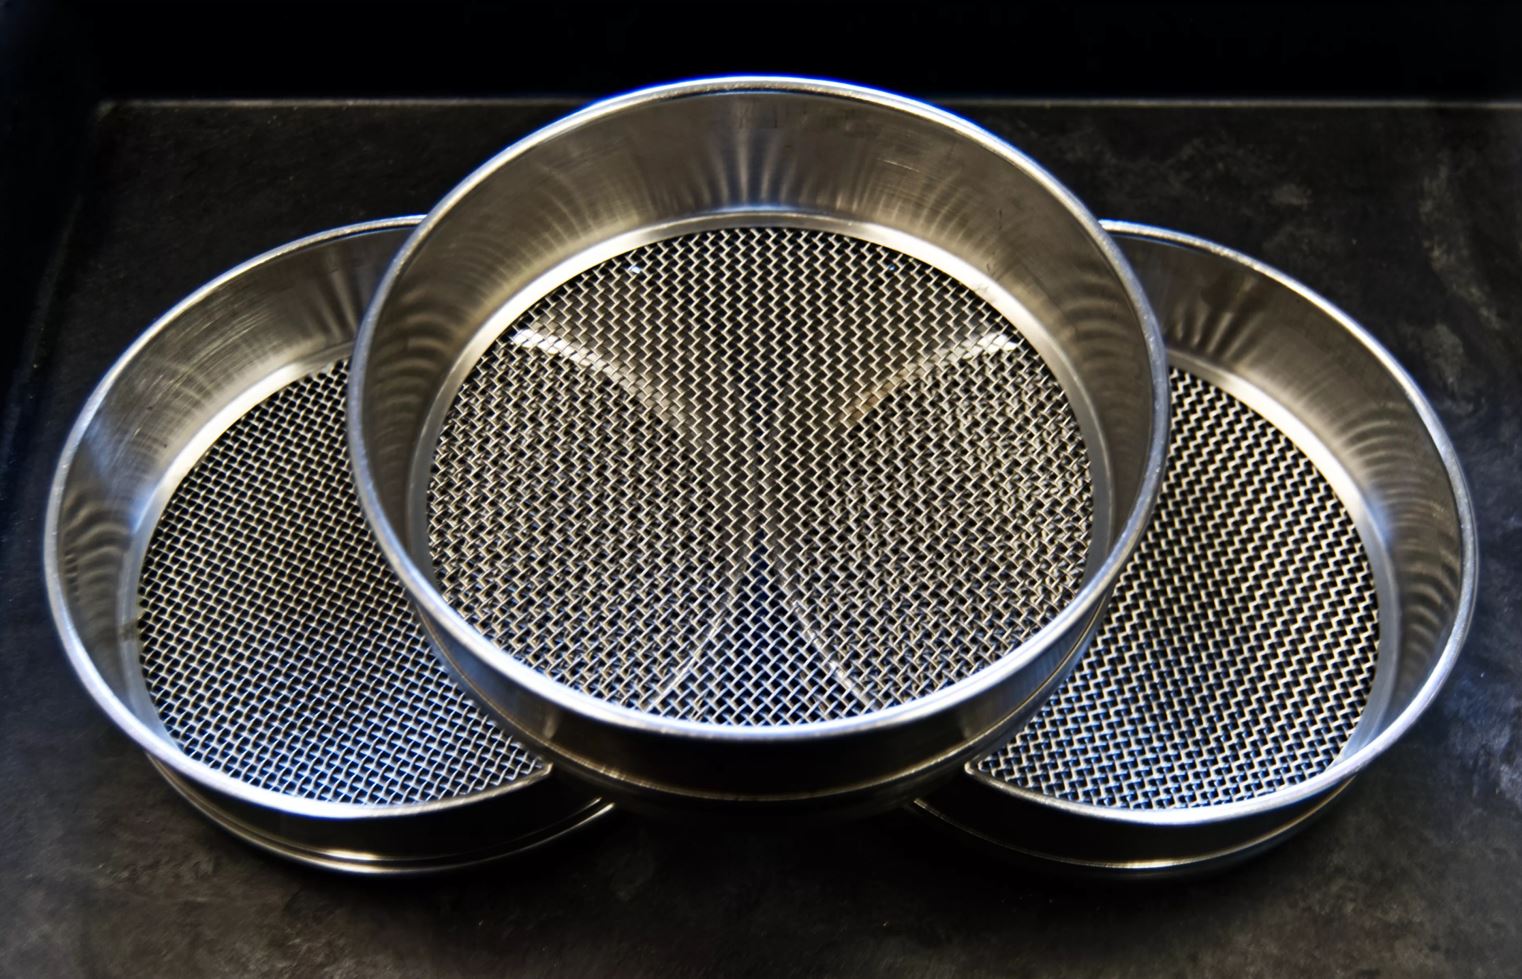
Preparing the experiment
The microapp includes an Experiment Assistant for preparing, validating, exporting, and reloading backend-compatible Excel workbooks. It supports both sieve-tower and air-jet sieving workflows. For air-jet tests, the initial sample mass and cumulative retained masses are converted into differential size-class masses, while the selected working method and sieve configuration are retained in workbook metadata.
Visualising particle size distributions
DDA-MAT-01 generates logarithmic and simplex PSD diagrams, as well as class-wise distribution charts. It derives cumulative and differential PSD quantities, D10, D50, and D90 characteristic diameters, and undersize, target-size, and oversize mass fractions for the selected sieve range.
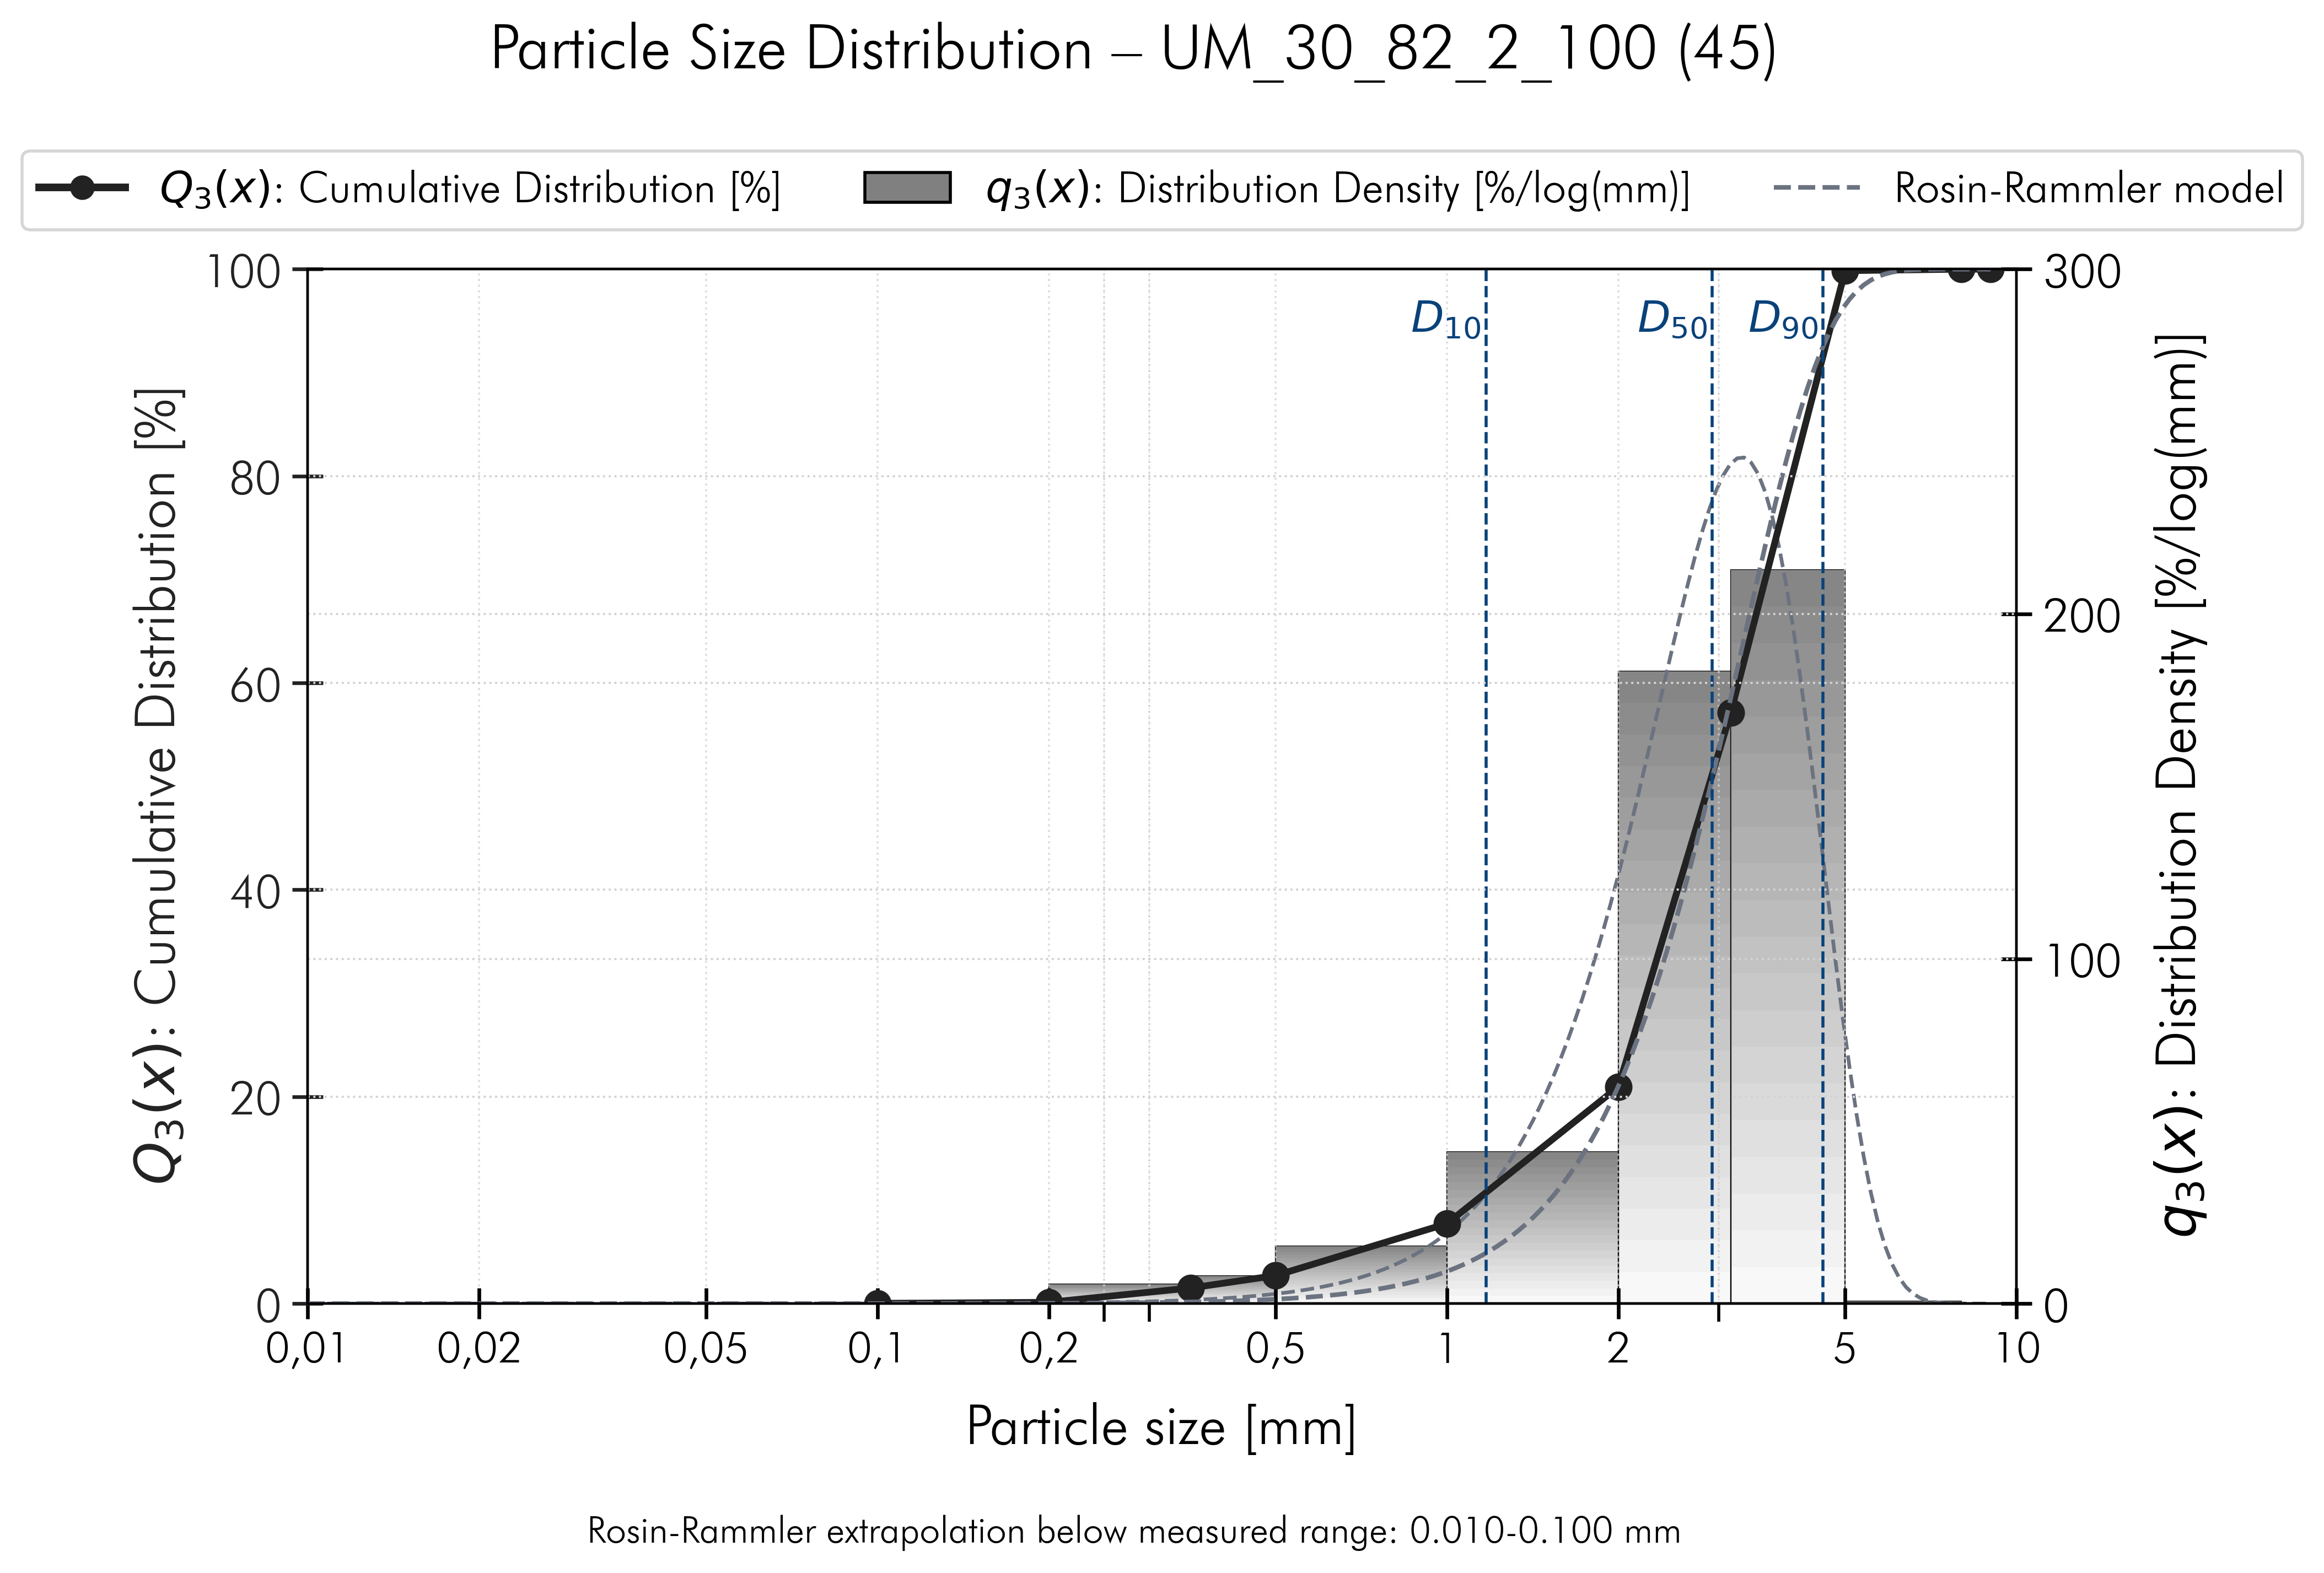
When sufficient valid measured cumulative points are available, an optional Rosin-Rammler model can be displayed separately from the experimental results. The model curve does not replace measured percentile values.
Traceable outputs
Each run produces timestamped diagrams, structured summary outputs, and a run log for traceability. The canonical psd_summary_canonical.json output can be used in compatible downstream DEPRODATA workflows.
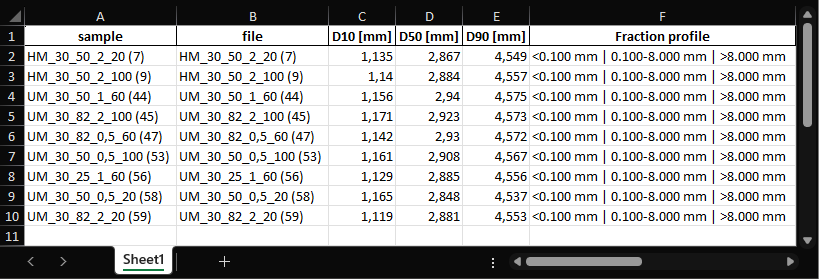
psd_percentiles_summary.xlsx.Application package
DDA-MAT-01 is distributed as a DEPRODATA .dpa package and runs through DEPRODATA Launcher in a portable runtime environment.
Reference
Espinosa, D. (2026). DEPRODATA Microapp DPD-MAT-01 (Material PSD): A modular application for reproducible particle size distribution analysis and reporting from sieve-analysis workbooks (v0.9.0). Zenodo.
DOI: 10.5281/zenodo.19010366.
The cited publication retains its original application name. The current public identifier is DDA-MAT-01. The DOI above identifies the record across versions.